Comparing UI performance VS API Performance Test
API performance testing using tools like JMeter has its disadvantages, and there is a need to complement it with UI performance testing to capture real-time user experience. Here are the disadvantages and the importance of UI performance testing:
- Lack of User Experience Perspective: API performance testing primarily focuses on the backend performance of the application, neglecting the impact on the end user. It fails to consider factors such as UI responsiveness, page rendering, and user interactions, which are crucial for delivering a satisfactory user experience.
- Inability to Detect Frontend Performance Issues: API performance testing tools like JMeter simulate API requests and measure server response times, but they do not capture frontend performance issues. UI performance testing, on the other hand, can identify problems like slow page rendering, unresponsive UI components, excessive resource utilization, or inefficient JavaScript execution.
- Lack of Insights into Actual User Behavior: API performance testing tools do not capture user behavior patterns, such as clicks, scrolls, or other UI interactions. These insights are essential for understanding how users interact with the application and identifying potential performance bottlenecks that may arise from specific user actions.
The need for UI performance testing alongside API performance testing lies in capturing the real-time user experience. UI performance testing enables:
- Measuring End-to-End Performance: UI performance testing takes into account the complete user journey, from initial page load to subsequent interactions, ensuring a comprehensive evaluation of the application’s performance.
- Identifying Frontend Performance Issues: UI performance testing tools can detect issues like slow rendering, excessive DOM manipulation, inefficient CSS usage, and other frontend-related problems that directly impact the user experience.
- Simulating Real User Scenarios: UI performance testing allows the simulation of various user scenarios, providing insights into how different user interactions affect the application’s performance. This helps in optimizing critical user paths and ensuring a smooth user experience across different devices and network conditions.
- Benchmarking User Experience: UI performance testing measures metrics like time to interact, time to first byte, and visual completeness, which provide a more accurate representation of the actual user experience. This data helps in setting performance benchmarks and tracking improvements over time.
Conclusion
In conclusion, while API performance testing tools like JMeter are valuable for assessing backend performance, UI performance testing is essential to capture real-time user experience, identify frontend issues, simulate realistic scenarios, and optimize critical user paths. Combining both approaches provides a comprehensive performance testing strategy for ensuring a high-quality user experience.
Solution: By integrating “wdio-performancetotal-service” plugin we can capture performance analysis from the WebdriverIO test framework.
Introduction to wdio-performancetotal-service
The “wdio-performancetotal-service” plugin for webdriver.io empowers you to seamlessly integrate performance analysis into your tests, regardless of whether they involve pure UI interactions, API requests, or a combination of both. This plugin offers a straightforward and effective approach to gauge the response times of various procedures, enabling you to pinpoint potential bottlenecks within your application.
Through the detailed performance metrics collected by this plugin, you can make informed decisions about optimizations and improvements to enhance the overall performance of your application. By analyzing the response times of different procedures, you can identify any outliers or consistently slow-performing areas, enabling you to prioritize and address those specific issues.
In summary, the “wdio-performancetotal-service” plugin provides a robust solution for integrating performance analysis into your tests, enabling you to measure response times, identify bottlenecks, and make data-driven decisions to optimize and improve the overall performance of your application.
How to Use?
The easiest way to install this module as a (dev-)dependency is by using the following command:
npm install wdio-performancetotal-service --save
Add wdio-performancetotal-service to your wdio.conf.js:
services: [
        'chromedriver',
        [
            'performancetotal',
            {
                disableAppendToExistingFile: false,                 performanceResultsFileName: `performance-results_${new Date().getTime()}`,                 dropResultsFromFailedTest: false,                 performanceResultsDirectory: `./ artifacts/performance-results`,                 analyzeByBrowser: false,
            },
        ],
    ],
It can be added along with ‘chromedriver’ or ‘selenium-standalone’
Usage in test
Just import performancetotal where you need it, whether it be in your test file or any other class. This object provides methods for measuring performance data in your tests, including sampleStart and sampleEnd for starting and ending performance measurements.
Here’s an example of how you might use the performancetotal object to measure the startup performance of two websites:
// This test case measures the startup performance of Github and SourceForge using the performancetotal object.

const {performancetotal} = require('wdio-performancetotal-service');

it('should test github and sourceforge startup performance', async () => {
    // Start a new performance measurement for Github     performancetotal.sampleStart('GH-Startup');

    // Navigate to Github     browser.url('https://github.com/');

    // End the Github measurement and save the results     performancetotal.sampleEnd('GH-Startup');

    // ...

    // Start a new performance measurement for SourceForge     performancetotal.sampleStart('SF-Startup');

    // Navigate to SourceForge     await browser.url('https://sourceforge.net/');

    // End the SourceForge measurement and save the results
    performancetotal.sampleEnd('SF-Startup');
});
Getting the results:
When all the tests are completed, a new results directory is created in the path specified as
“performanceResultsDirectory”. From the above configuration:
“`./ artifacts/performance-results”
Inside this directory, two files are created:
performance-results.json and performance-results.csv. with date stamp
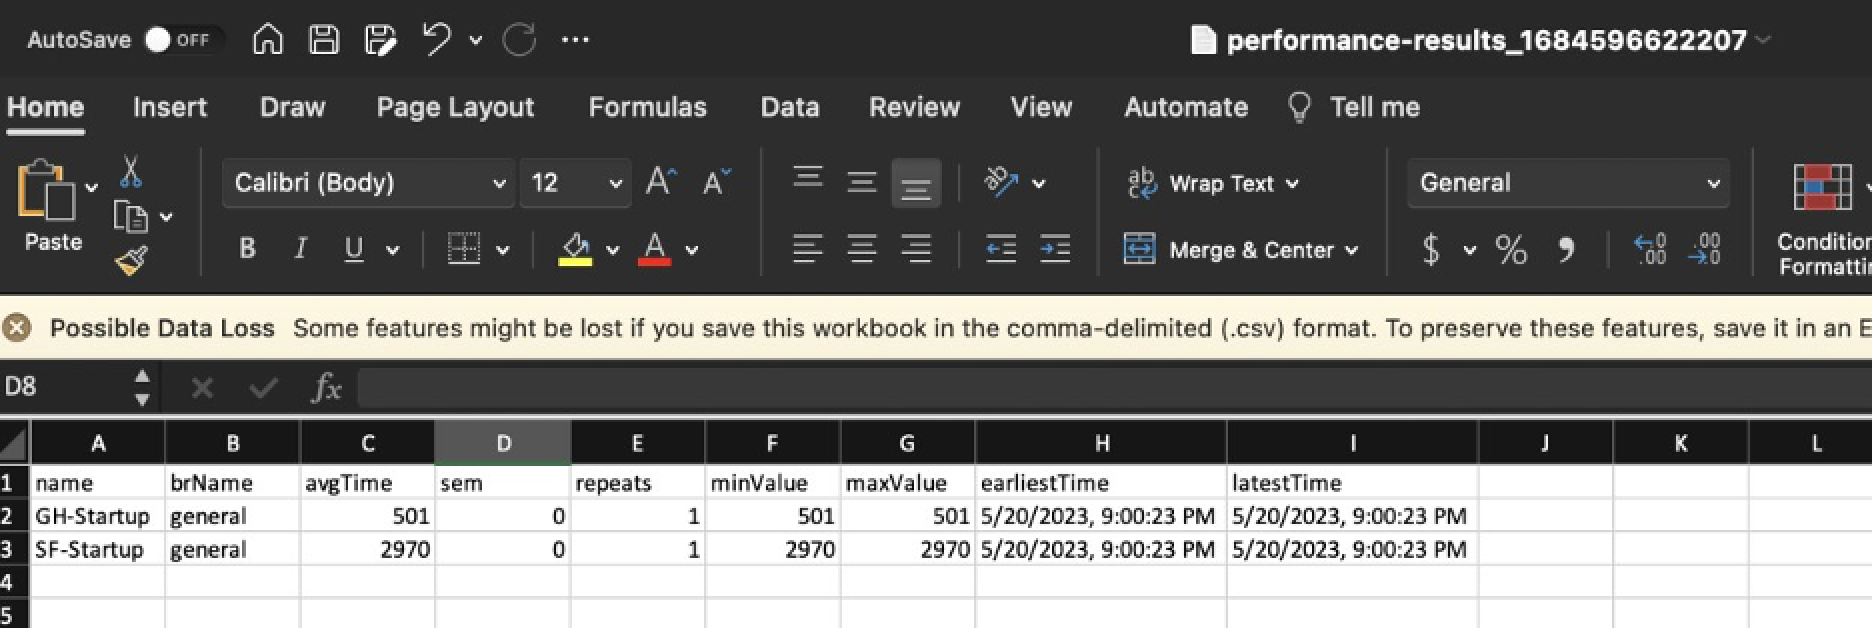
These files contain analyzed data for each sample, including the average time, standard error of the mean (SEM), number of samples, minimum value, maximum value, earliest time, and latest time.
Result Sample:
performance-results.csv.
Tip :
To obtain the most optimal results, it is recommended to incorporate explicit waits when loading the contents of each page. By implementing explicit waits, you can ensure that the performance analysis accurately reflects the actual loading times of the page elements.
Happy Testing!!